Debugging an iOS application or binary that employs anti-debugging techniques can be an immensely frustrating experience. As a researcher, you're often faced with a black box of opaque operations and deliberately obfuscated code designed to thwart your every attempt at understanding an application's behavior.
The usual debugging tools and techniques, which typically streamline the process, become almost ineffective, turning what should be a straightforward task into a complex puzzle. This not only hampers the efficiency of the debugging process but also tests the patience and ingenuity of even the most experienced researchers. This article will demonstrate a new technique developed by the Corellium team to expedite your dynamic analysis efforts and defuse attempts to slow down your progress.
What Is Anti-debugging?
The OWASP Mobile Application Security Verification Standard (MASVS) is a comprehensive framework for ensuring the security of mobile applications. This standard, developed by the Open Web Application Security Project (OWASP), provides a baseline for mobile app security, consisting of various levels of security requirements and recommendations. Among its extensive guidelines, the MASVS addresses the need for mobile applications to implement measures against reverse engineering and debugging, recognizing these activities as potential threats to mobile app security and user privacy.
Specifically, it emphasizes the importance of incorporating debug-checking mechanisms. This includes detecting and responding to the presence of a debugger, ensuring that code and sensitive data are not exposed during debugging sessions, and preventing debugging tools from modifying or tampering with the app.
By implementing these recommendations, developers can better protect their applications from unauthorized analysis and exploitation, which is crucial for maintaining the integrity and confidentiality of both the application and its user data.
There are a few well-documented anti-debugging techniques like:
- Using sysctl to detect if the ptrace flag is set, which may cause the application to abort or behave differently while under introspection. [1]
- Using ptrace directly to set PTRACE_DENY_ATTACH, preventing the parent process from debugging it. [2]
- Using getppid()to determine if an application was launched by launchd (pid 1)
The iOSSecuritySuite has a very clean implementation of these checks, which can easily be baked into an iOS application. For this demo, we will reimplement one of these checks into a simple binary we can run from the iOS console. The application is pretty straightforward:
- Set a random 8-byte flag to an NSString
- Print out some helpful debug information about the userland process, like the executable's base address and the flag's address.
- Wait for user input (mostly to pause for attaching a debugger)
- Exit
Let's run the application first without any sort of debug protections enforced:
Then we can simply attach it to the process with the debugserver and open a port for our remote lldb client to talk to...
and using the debug information provided by the binary, we can print out the contents of the flag
Excellent, we can see the contents of our NSString object right at the address supplied by the program.
Now we will reimplement .denyDebugger() from the IOSSecuritySuite [3] into our application.
If we rerun the program with this added functionality, we get an entirely different experience:
By setting the PT_DENY_ATTACH flag, debugserver/lldb is unable to attach to the process. Techniques like these are not bulletproof and can usually be bypassed through clever combinations of hooking and patching. However, there are also ways for applications to detect if they are being instrumented or if the integrity of the application has been violated. Defeating these various mitigations is time wasted that could have been spent on proper dynamic analysis of your target.
What if we could debug this application without it even knowing it?
Debug on iPhone with Corellium
It's no secret that Corellium offers a gdb-stub in the kernel which you can use with both gdb and lldb. The kernel debugger is a valuable tool for gaining a deeper understanding of iOS internals and performing vulnerability research. It can even be chained together with our debug accelerator tool to provide a much faster debugging experience if you have to deal with latency in a cloud environment.
Your Corellium VM exposes the kernel debug stub on service_ip:4000, which you can connect to with anything that speaks the gdb protocol. We will use lldb for this example:
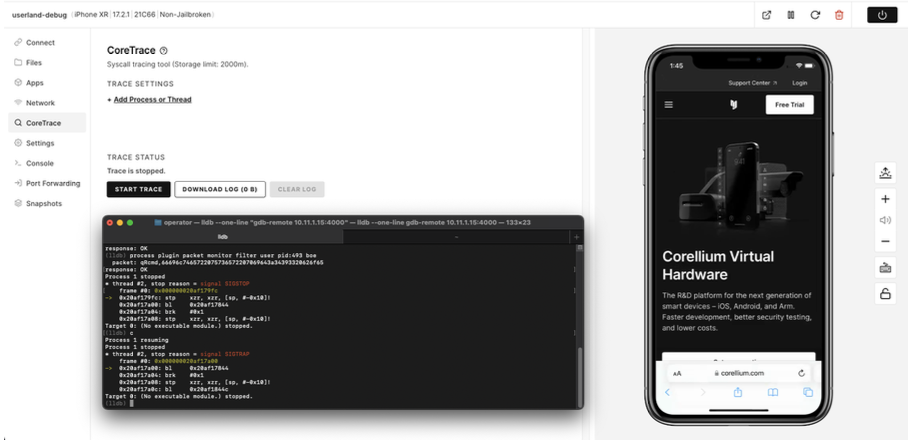
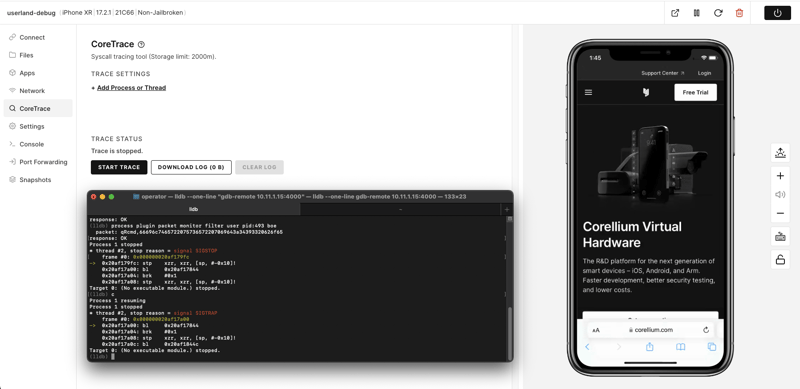
You can also use the kernel debugger to debug userland processes, instantly defeating all of the above countermeasures. Using the monitor filter feature, we can specify a userland process by either its name, pid, or tid. You can also specify if you want to break on entering the userland process with the boe flag (optional)
(lldb) process plugin packet monitor filter user pid:814 boe
Here, we've instructed the kernel to break into the process we specified with the pid: flag above.
As you can tell by the frames, we have switched our debugging context from the kernel to a userland process. The program also behaves normally, none the wiser that we are quietly debugging it. Now, using the debug information provided by the program, we can use lldb to print the contents of our userland NSString object.
Voila! You can also use this technique to debug Corellium's non-jailbroken models if you want to debug com.apple.WebKit.WebContent on a non-jailbroken vm, just attach to the kernel debugger and follow the same steps above.
References
[1] - ptrace flag
[2] - OpenBSD ptrace
[3] - iOS Security Suite Github
Advance Your Mobile Security Research with Corellium
Experience Corellium’s groundbreaking virtualization technology for mobile devices and streamline iOS debugging like never before. Discover new ways to debug iOS apps and conduct mobile vulnerability and threat research on iPhone and Android phones.
Book a meeting today to explore how our platform can optimize mobile security research and malware analysis.