Persistence is a tactic used by attackers and jailbreakers1 to maintain a foothold on a device after reboot, and can be a valuable component of an exploit chain. Fundamentally, this requires attacker-controlled data to be processed at some point in the course of booting, so creating a mapping of files opened by various processes should provide a useful first approximation of the cyber attack surface.
The general strategy for obtaining that information is by logging the process name and file path to every call to the open(2) system call.
Corellium possesses a number of properties that assist with building this mapping:
- Ability to run and introspect versions of iOS that lack a public jailbreak
- The kernel debugger, which works even when the virtual device isn't jailbroken
- Hypervisor hooks, a tool for hooking the kernel and executing small snippets of C-like code
- Ability to start the device paused and attach the debugger to the first instruction
For this post we'll be using current latest release of iOS (15.5/19F77) on the iPhone 7, and will need two of them with slightly different configurations:
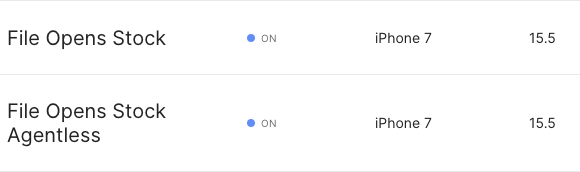
- File Opens Stock: Non-jailbroken2, with agent installed. This will be used later as the target for some calls to the Corellium API which require the Corellium agent.
- File Opens Stock Agentless: Non-jailbroken, with agent installed. This will be the main target for the collection of the calls to `open(2)`
Once both devices are created, let them boot fully the first time. The first boot of a virtual device on Corellium includes extra steps for the restoration process and we don't want to include that in the results.
Now that the devices are ready, we need to figure out where to hook in the kernel to get the desired data.
Finding the hook point
Locating the system call table and open(2)
This is going to require some static analysis of the kernel using both Binary Ninja and jtool2.
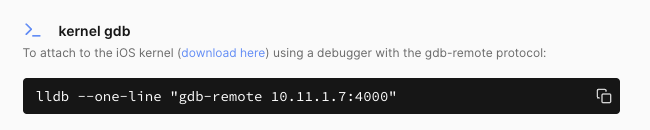
First, download the kernel binary from one of the virtual devices by clicking the "download here" link on the Connect tab:
Load the kernel into Binary Ninja and let it start analyzing. In the meantime, use jtool2 --analyze on the kernel to generate the companion file containing some symbols:
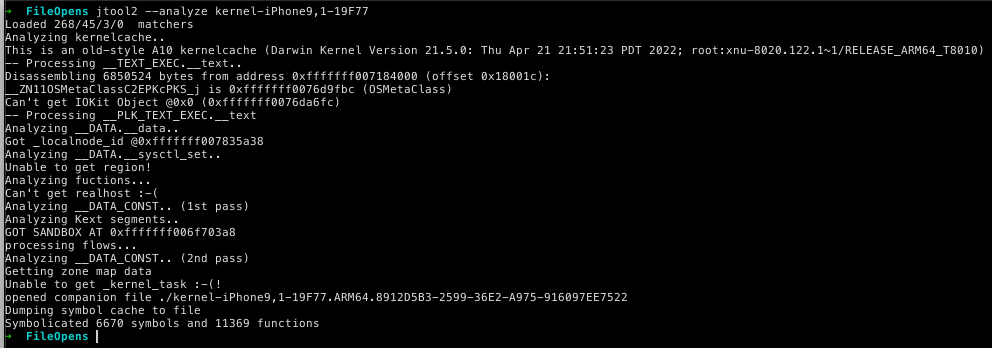
The key symbol to find is sysent, which contains the system call table:
$ grep sysent kernel-iPhone9,1-19F77.ARM64.8912D5B3-2599-36E2-A975-916097EE7522
0xfffffff007148100|_sysent|
Once Binary Ninja is finished analyzing, go to that address and examine it:
This symbol is an array of struct sysent structures:
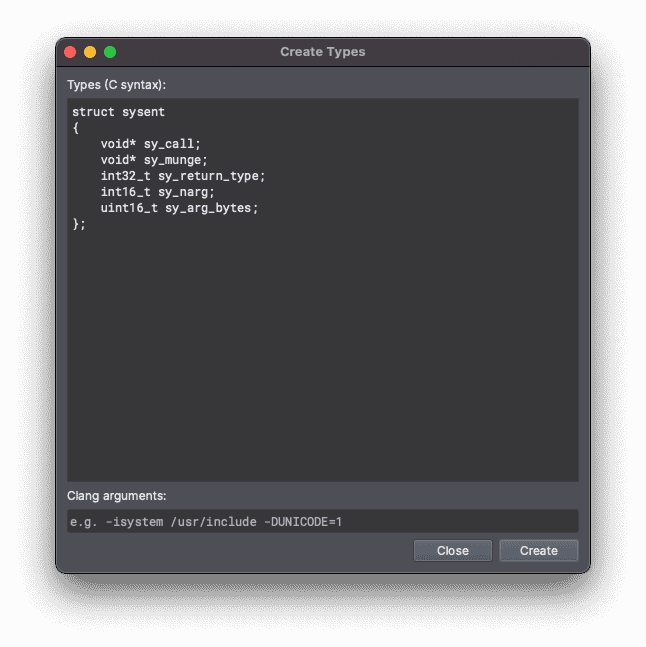
struct sysent {         /* system call table */
	sy_call_t       *sy_call;       /* implementing function */
#if CONFIG_REQUIRES_U32_MUNGING || (__arm__ && (__BIGGEST_ALIGNMENT__ > 4))
	sy_munge_t      *sy_arg_munge32; /* system call arguments munger for 32-bit process */
#endif
	int32_t         sy_return_type; /* system call return types */
	int16_t         sy_narg;        /* number of args */
	uint16_t        sy_arg_bytes;   /* Total size of arguments in bytes for
	                                 * 32-bit system calls
	                                 */
};
Where sy_call is a pointer to the implementation of the system call itself. Looking at the master list of system calls we can see that open(2) is system call #5:
0	AUE_NULL	ALL	{ int nosys(void); }   { indirect syscall }
1	AUE_EXIT	ALL	{ void exit(int rval) NO_SYSCALL_STUB; }
2	AUE_FORK	ALL	{ int fork(void) NO_SYSCALL_STUB; }
3	AUE_NULL	ALL	{ user_ssize_t read(int fd, user_addr_t cbuf, user_size_t nbyte); }
4	AUE_NULL	ALL	{ user_ssize_t write(int fd, user_addr_t cbuf, user_size_t nbyte); }
5	AUE_OPEN_RWTC	ALL	{ int open(user_addr_t path, int flags, int mode) NO_SYSCALL_STUB; }
...
By tweaking the structure definition a bit to turn the typedef'd function pointers into void pointers and removing the preprocessor directives, we can then create a new type in Binary Ninja by switching to the Types tab, right-clicking, and selecting Create New Types...
Now we can change the type of the first few system call table entries by selecting the first byte, pressing Y, and filling in the dialog:
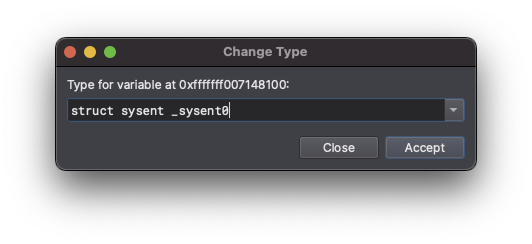
Repeating this a few more times, we get to the fifth entry, and can then rename the sy_call field to SYS_open:
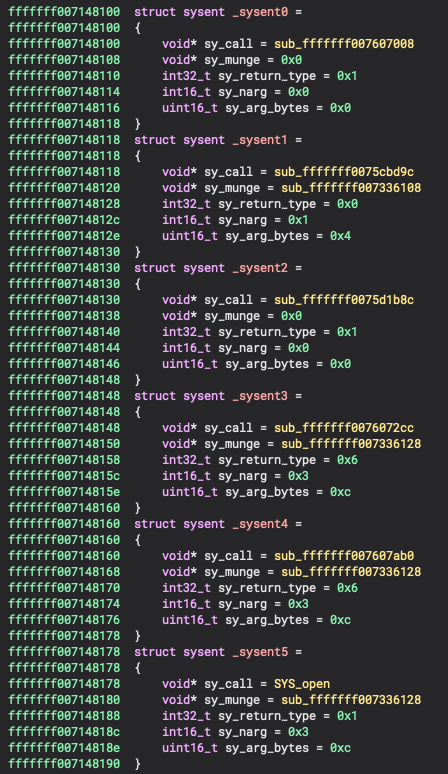
Now we can go into the function and take note of the address for later: 0xfffffff00736a8c0
Analyzing the system call handler
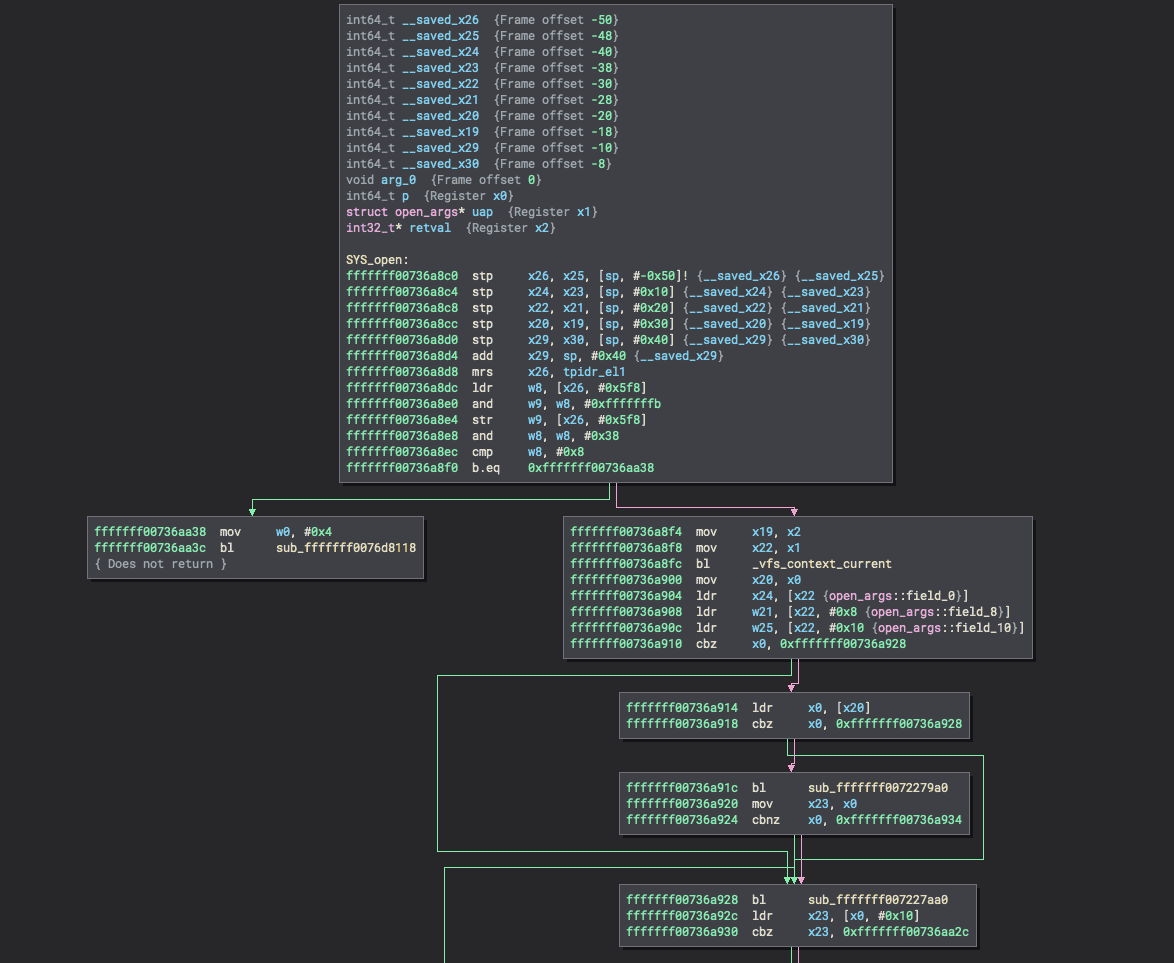
The handler for open(2) can be found in the XNU source code in bsd/vfs/vfs_syscalls.c.
int
open(proc_t p, struct open_args *uap, int32_t *retval)
{
	__pthread_testcancel(1);
	return open_nocancel(p, (struct open_nocancel_args *)uap, retval);
}
All system call handlers will have the same set of arguments, where the second argument is a structure type specific to that system call. This structure is generated automatically at build-time by parsing the definition from syscalls.master. We can infer that struct open_args will be something like this:
struct open_args {
    user_addr_t path;
    int flags;
    int mode;
};
Since path is the first field of the structure, dumping X1 in the debugger at the start of the function should produce a user-space address pointing to the desired path to open!
It would also be helpful to know which process is attempting to open the path. Fortunately, the first argument to a system call handler is a pointer to the proc_t that made the call. The proc_t structure is quite large and out of scope of this post, but one field jumps out:
struct proc {
    LIST_ENTRY(proc) p_list; /* List of all processes. */

[snip]

    command_t p_comm;
};
Where command_t is defined as a fixed-size character array:
#define MAXCOMLEN 16

typedef char command_t[MAXCOMLEN + 1];
So this field will be available at some fixed offset from the address in X0 at the start of the function. Now it’s time to jump into the kernel debugger and test these findings.
Kernel Debugging from the Entry Point
Select the agentless virtual device and select to start the device paused from the dropdown in the power button:

After a moment, the device will now be waiting for the kernel debugger to attach. Once connected by copying the command from the Connect tab (and connecting to the VPN first), we can set the breakpoint on the first instruction of SYS_open (br set -a 0xfffffff00736a8c0) and continue execution (continue). Once the breakpoint triggers, we can check the assumptions about the contents of X1.
The very first call to open(2) is made by launchd to load the dyld_shared_cache, which makes sense, so the prior analysis appears to hold true!
It would be tedious to capture each result manually in the debugger like this, and even automating lldb a bit to perform these commands each time the breakpoint is triggered wouldn't be particularly performant.
Fortunately, Corellium has a better option: Hypervisor Hooks, which we can use directly from within the kernel debugger, so leave the device paused at the current breakpoint for now.
Sidebar: offsetof(proc_t, p_comm)
There’s a magic number in one of the lldb commands above, 0x370. The proc_t structure does change every so often, so this offset may not work on other versions of iOS. Fortunately, it’s not difficult to find the correct offset in the debugger.
(lldb) gdb-remote 10.11.1.5:4000
Process 1 stopped
* thread #1, stop reason = signal SIGINT
frame #0: 0x00000008031904e8
-> 0x8031904e8: b 0x803194078
0x8031904ec: nop
0x8031904f0: nop
0x8031904f4: nop
Target 0: (No executable module.) stopped.
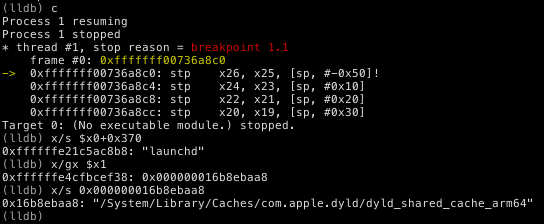
(lldb) br set -a 0xfffffff00736a8c0
Breakpoint 1: address = 0xfffffff00736a8c0
(lldb) c
Process 1 resuming
Process 1 stopped
* thread #1, stop reason = breakpoint 1.1
frame #0: 0xfffffff00736a8c0
-> 0xfffffff00736a8c0: stp
0xfffffff00736a8c4: stp
0xfffffff00736a8c8: stp
0xfffffff00736a8cc: stp
x26, x25, [sp, #-0x50]!
x24, x23, [sp, #0x10]
x22, x21, [sp, #0x20]
x20, x19, [sp, #0x30]
Target 0: (No executable module.) stopped.
(lldb) x/128gx $x0
0xffffffe30200c548: 0xfffffff007835f68 0xfffffff007896198
0xffffffe30200c558: 0xffffffe3029012d8 0xfffffff007835f68
0xffffffe30200c568: 0xffffffe0e90a41e0 0x0000000000000000
0xffffffe30200c578: 0x0000000000000000 0x0000000000000000
0xffffffe30200c588: 0x0000000000000000 0x0000000000000000
0xffffffe30200c598: 0x0000000000000000 0x0000000000000000
0xffffffe30200c5a8: 0x0000000022000000 0x0000000200000001
0xffffffe30200c5b8: 0x0000000000000000 0xfffffff007835fd8
0xffffffe30200c5c8: 0x0000000000000000 0xfffffff007835ff8
0xffffffe30200c5d8: 0x0000000000000000 0xffffffe21bf39a20
0xffffffe30200c5e8: 0xffffffe21bf39b38 0x0000000000000000
0xffffffe30200c5f8: 0x0000000000000000 0x0000000000000000
0xffffffe30200c608: 0x0000000000000000 0x0000000000000000
0xffffffe30200c618: 0x0000000022000000 0x0000000000000000
0xffffffe30200c628: 0x0000000022000000 0x0000001900120000
0xffffffe30200c638: 0x0000000000000000 0xffffffe21c0e3300
0xffffffe30200c648: 0xffffffe21c0e33c8 0x0000000000000000
0xffffffe30200c658: 0x0000000000000000 0x0000000000000000
0xffffffe30200c668: 0xffffffe21b7f0300 0x0000000000000000
0xffffffe30200c678: 0x0000000000420000 0x0000000000000000
0xffffffe30200c688: 0x0000000000000000 0x0000000022000000
0xffffffe30200c698: 0x0000000000000000 0x0000000000000000
0xffffffe30200c6a8: 0x0000000000000000 0x0000000022000000
0xffffffe30200c6b8: 0x0000000000000000 0x0000000000000000
0xffffffe30200c6c8: 0xffffffe3e8eb8800 0xfffffff0078c0490
0xffffffe30200c6d8: 0xffffffe3e93b4038 0xffffffe0e9174400
0xffffffe30200c6e8: 0x0000000000000000 0x0000000000000000
0xffffffe30200c6f8: 0x0000000000000000 0x0000000000000000
0xffffffe30200c708: 0x0000000000000000 0x0000000000000000
0xffffffe30200c718: 0x0000000000000000 0x0000000000000000
0xffffffe30200c728: 0x0000000000000000 0x0000000000000000
0xffffffe30200c738: 0x0000000000000000 0x0000000000000000
0xffffffe30200c748: 0x0000000000000000 0x0000000000000000
0xffffffe30200c758: 0x0000000000000000 0x0000000000000000
0xffffffe30200c768: 0x0000000000000000 0x0000000000000000
0xffffffe30200c778: 0x0000000000000000 0x0000000000000000
0xffffffe30200c788: 0x0000000000000000 0x0000000000000000
0xffffffe30200c798: 0x0000000000000000 0x0000000000000011
0xffffffe30200c7a8: 0x0000400400000000 0x0000000000000000
0xffffffe30200c7b8: 0x0000004000000000 0x0000000000000001
0xffffffe30200c7c8: 0x0000000000000000 0x0000000000000000
0xffffffe30200c7d8: 0x0000000000000000 0x0000000000000000
0xffffffe30200c7e8: 0x0000000000000000 0x0000000000000000
0xffffffe30200c7f8: 0x0000000000000000 0x0000000000000000
0xffffffe30200c808: 0x0000000000000000 0x0000000000000000
0xffffffe30200c818: 0x0000000000000000 0x0000000000000000
0xffffffe30200c828: 0x0000000000000000 0x0000000000000000
0xffffffe30200c838: 0x0000000000000000 0x0000000000000000
0xffffffe30200c848: 0x0000000000000000 0x0000000000000000
0xffffffe30200c858: 0x0000000000000000 0x0000000000000000
0xffffffe30200c868: 0x0000000000000000 0x0000000000000000
0xffffffe30200c878: 0x0000000000000000 0x0000000000000000
0xffffffe30200c888: 0x00000001000001c0 0x000000016f698000
0xffffffe30200c898: 0xffffffe21b7f0a00 0x0000000000000000
0xffffffe30200c8a8: 0x1848800000000000 0x0000001100000000
0xffffffe30200c8b8: 0x006468636e75616c 0x00000000006b7361
0xffffffe30200c8c8: 0x6468636e75616c00 0x000000006b736100
0xffffffe30200c8d8: 0x0000000000000000 0x0000000000000000
0xffffffe30200c8e8: 0x0000000000000000 0x661b10f600000000
0xffffffe30200c8f8: 0xfd56f59a2b30bce1 0x0100000c2660f2c8
0xffffffe30200c908: 0x0000000000000000 0x0000000000000000
0xffffffe30200c918: 0x0000000000000000 0xffffffe30200c918
0xffffffe30200c928: 0x0000000000000000 0xffffffe30200c928
0xffffffe30200c938: 0x0000000000000000 0x0000000000000000
(lldb) x/s 0xffffffe30200c8b8
0xffffffe30200c8b8: "launchd"
(lldb) p/x 0xffffffe30200c8b8-$x0
(unsigned long) $13 = 0x0000000000000370
(lldb)
By examining a large portion of X0, small bits of null-terminated ASCII text jump out, which turns out to be the process name. Then simple subtraction yields the offset: 0x370.
Hypervisor hooks
Corellium has a neat feature that can help with this type of use case, allowing for small C-like snippets of code to execute when a given address is reached. This is substantially faster than a debugger breakpoint because it doesn't involve any round-trip to the instance of lldb or gdb on the local machine, and the hooks run on all cores without locking. Consequently, the virtual device continues running even while the hook is being executed.
In this case, the hook body is fairly simple, essentially replicating the same steps performed when the breakpoint triggered, but instead logging to the console. Conveniently, this logging is in purple to distinguish it from regular logging the device performs normally. Here is the full command to set the hook, which we will then go over piece by piece:
process plugin packet monitor patch 0xfffffff00736a8c0 print_str("Process",
    (void *)(cpu.x[0]+0x370), 32); \
    u64 path_kaddr = *(u64 *)cpu.x[1]; \
    print_str("Path", (void *)path_kaddr, 1024); \
    print("\n");
*Note that while the lines are split here, they should all be on one line when entering into lldb!*
process plugin packet monitor is the rather unwieldy lldb command to send a monitor command3 to the remote debugger stub.
patch is the monitor command to apply a hook. It accepts two arguments: the address to hook and the body of the code to run when the address is reached.
print_str() prints a null-terminated string buffer to the console with an optional prefix, and requires a maximum size parameter. In this case, it is printing cpu.x[0]+0x370, which is equivalent to the form $x0+0x370 from lldb.
u64 path_kaddr = *(u64 *)cpu.x[1]; deferences the first qword at X1, which is the path argument to the system call, and saves it in a new variable path_kaddr provided by the hook infrastructure.
print_str("Path", (void *)path_kaddr, 1024); prints a null-terminated string from the second argument, up to the size in the third argument, with an optional string literal prefix from the first argument. PATH_MAX is defined as 1024.
Finally, print("\n"); prints a newline so that the formatting is a little bit nicer.
Once the hook is set, we can collect the data for the rest of the boot process.
Collecting the results
After sending the patch command, be sure to delete the previous breakpoint (br del 1). Before continuing, we need to get set up to record the data.
The easiest way to do this is to use netcat to connect to the console port and write the results to a file:
$ nc 10.11.1.5 2000 | tee file_opens.txt
Now continue in lldb (keep it connected) and watch the result pour in:
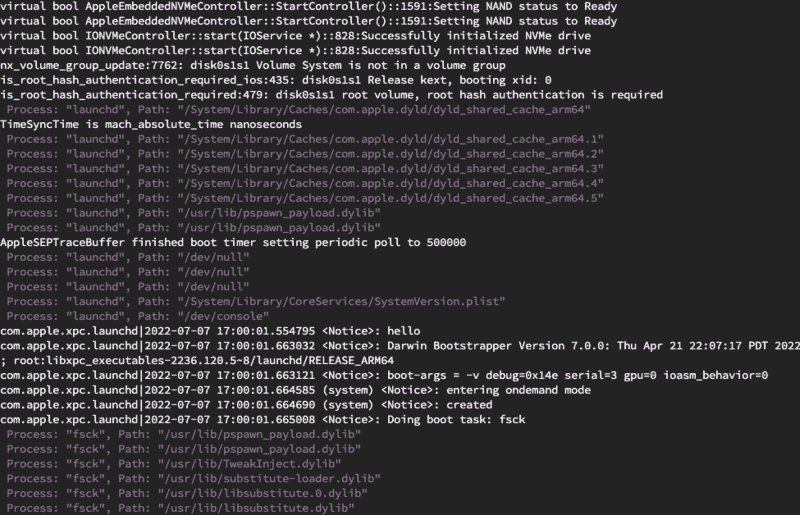
Once the device is fully booted and Springboard is usable, disable the hook:
(lldb) process interrupt
Process 1 stopped
* thread #2, stop reason = signal SIGINT
    frame #0: 0xfffffff0071e6ac8
->  0xfffffff0071e6ac8: nop
    0xfffffff0071e6acc: ldr    w2, -0xff8edb9d0
    0xfffffff0071e6ad0: mov    x0, x19
    0xfffffff0071e6ad4: mov    w3, #0x1
Target 0: (No executable module.) stopped.
(lldb) process plugin packet monitor patch 0xfffffff00736a8c0 -
Now the debugger can be disconnected and the device turned off.
Post-processing
Next we have to process the collected data into something that can be imported into a graph database. This requires a few steps, which we'll build up into a one-liner, so don't run these commands yet.
Since the file contains the full console log, the first step is to reduce to only lines that contain the desired logging.
$ grep 'Process: ' file_opens.txt | [...]
Most lines will only contain the desired logging, but some will include normal system logging before the "Process: " sentinel. Fortunately, that's easy to remove. This sed command extracts the contents between the control characters used for changing the text color:
[...] | sed -e 's/.*\[95m\ \(.*\)\[39m/\1/' | [...]
Now it might be nice to deduplicate and have a count of the number of times a process opened the same file:
[...] | uniq -c > uniq_opens.txt
Putting it all together:
$ grep 'Process: ' file_opens.txt | sed -e 's/.*\[95m\ \(.*\)\[39m/\1/' | uniq -c > uniq_opens.txt
Now the output is nice and tidy:
   1 Process: "launchd", Path: "/System/Library/Caches/com.apple.dyld/dyld_shared_cache_arm64"
   1 Process: "launchd", Path: "/System/Library/Caches/com.apple.dyld/dyld_shared_cache_arm64.1"
   1 Process: "launchd", Path: "/System/Library/Caches/com.apple.dyld/dyld_shared_cache_arm64.2"
   1 Process: "launchd", Path: "/System/Library/Caches/com.apple.dyld/dyld_shared_cache_arm64.3"
   1 Process: "launchd", Path: "/System/Library/Caches/com.apple.dyld/dyld_shared_cache_arm64.4"
   1 Process: "launchd", Path: "/System/Library/Caches/com.apple.dyld/dyld_shared_cache_arm64.5"
   3 Process: "launchd", Path: "/dev/null"
   1 Process: "launchd", Path: "/System/Library/CoreServices/SystemVersion.plist"
   1 Process: "launchd", Path: "/dev/console"
   1 Process: "fsck", Path: "/System/Library/FeatureFlags/GlobalDisclosures.plist"
[...]
Analyzing the data
Neo4J Graph Database is a convenient tool for visualizing and querying the collected data to find interesting files for further analysis. For example, it might be helpful to know which files are:
- Opened by a privileged process
- Writable in a post-exploitation state, such as after initial jailbreaking
- Contains interesting data such as complicated serialization formats
For example, iOS 11 was untethered by exploiting the racoon VPN client, specifically exploiting the parser for a configuration file racoon.conf which is read during boot, so the goal of this project is to identify similar cases.
Other database types (relational, NoSQL, etc.) could also be used for this type of data, but graph databases have interesting visualizations and can help analysis by clustering nodes when the same file is opened by multiple processes.
Neo4J Primer
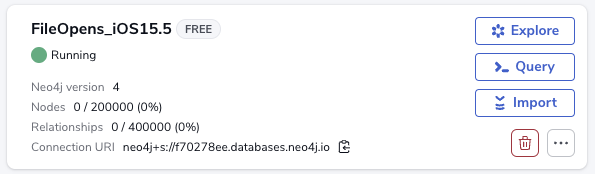
While Neo4J Desktop is freely available, for this project we'll be using the free tier of the cloud-base AuraDB, which is a managed cloud instance of Neo4J. After creating an account, create an empty database named FileOpens_iOS15.5:
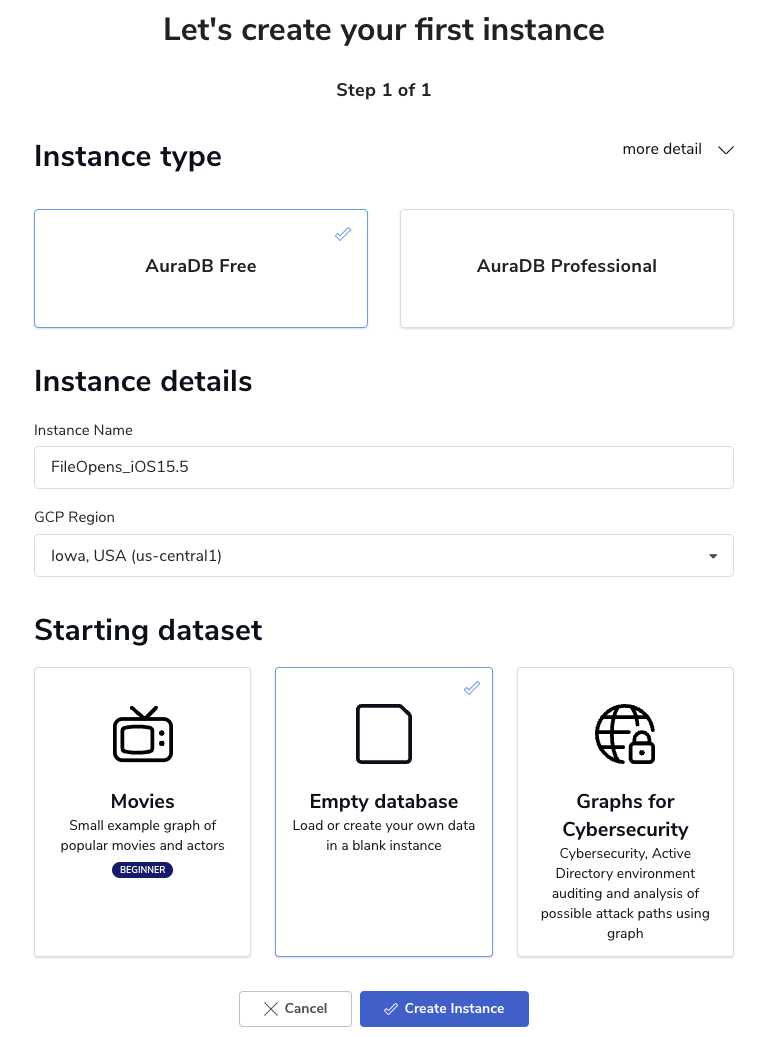
Be sure to save the credentials on the next page, as we'll need those later and there's no way to recover them. Once the instance is running, click the Query button to enter the web interface.
Neo4J's query language (named Cypher) is fairly simple to use for this simple case. We essentially need two types of commands to load the data: Creating a node and linking nodes together.
Node creation can be very simple, such as creating an empty node:
CREATE (n)
This isn't particularly useful on its own, so let's try adding a label to designate the type of the node. For our purposes, we'll have :Process nodes and :File nodes. Note that labels start with a colon. While we're at it, we need to include other information such as the name of the process. This is represented as a property, which is provided as a dictionary during or after creation.
To represent launchd for example:
CREATE (p:Process {name: "launchd", path: "/sbin/launchd"})
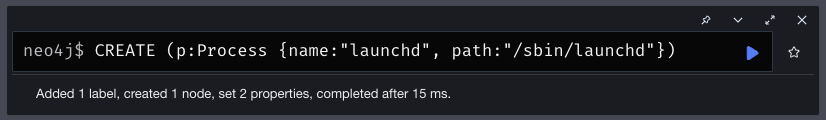
Note that the identifier before the first label is arbitrary, acting as a variable for the new node, which will matter for creating relationships between nodes. Now we need a :File node. Let's make up some examples of what files launchd might open and create nodes for them:
CREATE (f1:File {path:"/etc/passwd"})
CREATE (f2:File:DIRECTORY {path:"/Library/LaunchDaemons"})
Now we can link them together:
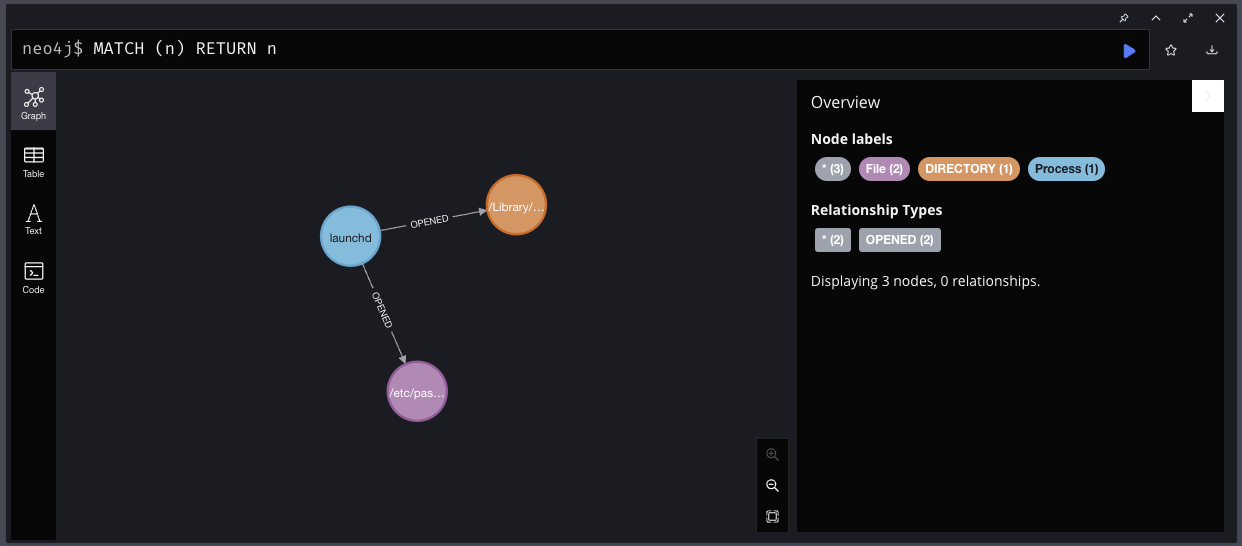
MATCH (p:Process {name: 'launchd'}), (f:File {path: '/etc/passwd'}) CREATE (p)-[:OPENED]->(f)
And:
MATCH (p:Process {name: 'launchd'}), (f:File {path: '/Library/LaunchDaemons'}) CREATE (p)-[:OPENED]->(f)
This looks up a :Process node with the given properties and places the reference in the variable p, then looks up the requested :File node into f, and finally creates a directional relationship between p and f with a label of :OPENED. Now we can query and see the full graph:
MATCH (n) RETURN n
Now let's delete the test data (all nodes and relationships) to prepare for the next step:
MATCH (n) DETACH DELETE n
Enriching the Data
It might be nice to have some additional information included in the database, such as
- Whether the file being opened is a directory, device file, etc.
- Whether the file is missing from the filesystem, for example extra functionality of a daemon might only be enabled if a certain file exists
- Whether the file is present in the filesystem as it exists in the original IPSW or if it's created dynamically on the device
- The type of the file
- Metadata such as permissions, owner, group, and size
All of these can be represented as either labels (e.g. :MISSING, :DIRECTORY, and :DEVICE_FILE) or properties (e.g. {size: 1048576, owner:0, group:0}). The general plan is to check each opened file first from the local filesystem and then from the remote device if necessary.
To obtain this information we'll need two things:
- The original IPSW which contains the filesystem as a DMG file
- A running virtual device with the correct version of iOS and the Corellium agent installed (this was mentioned above as the device File Opens Stock)
The IPSW can be obtained with the ipsw tool (install with brew install ipsw) and extracted. Then the root filesystem (the largest DMG) can be opened:
$ ipsw download -d iPhone9,1 -b 19F77
[...]
$ unzip iPhone_4.7_P3_15.5_19F77_Restore.ipsw
[...]
$ ls -lh *.dmg
-rw-r--r--  1 chris  staff   109M Jan  9  2007 078-12353-117.dmg
-rw-r--r--  1 chris  staff   111M Jan  9  2007 078-12372-116.dmg
-rw-r--r--  1 chris  staff   4.9G Jan  9  2007 078-12575-105.dmg
$ open 078-12575-105.dmg
Once the filesystem is mounted, a setting must be toggled so that the original permissions are respected. Otherwise, all files will be owned by the user that mounted the volume, which mangles the data.
$ sudo diskutil enableOwnership /Volumes/SkyF19F77.D10D101D20D201OS
Password:
File system user/group ownership enabled
$
For remote files, we'll use the Corellium API for retrieving both file metadata (stat) and file contents as necessary. Note that there are two separate client libraries and we're using the older one. This is because it has some functionality that the newer library does not have at the time of this writing (specifically the parts we need: stat and file download).
Two Node.js scripts are provided in the repository: stat_file.js and download_file.js. They both read Corellium account and target device information from a configuration file in the same directory, which must be created before use by copying config.json.example to config.json and filling in the fields. The device UUID should be for the "File Opens Stock" device, since the Corellium agent (corelliumd) is required for these API features.
The Python library python-magic is also used to determine the type of each file whenever possible, which is added as a property to each :File node.
Putting it all together
A Python script is provided to enrich the data, create Cypher commands, and send them to the remote AuraDB instance. To run:
- Ensure that the uniq_opens.txt file exists from earlier, edit the LOGFILE = 'uniq_opens.txt' line in process_opens.py to match the name.
- Edit the ROOT_FS_PATH line in process_opens.py to match the mounted root filesystem.
- Edit the NEO4J_ lines in process_opens.py to match the configuration of either local Neo4J Desktop or AuraDB. Ensure that the database is running and empty.
- Ensure that config.json exists (copy from config.json.example) and has correct Corellium settings.
- From within the root of the repository, run npm install to install the Corellium API library.
- From within the root of the repository, ensure that the Python libraries are installed:
- Run python3 -m virtualenv ENV.
- Run source ./ENV/bin/activate.
- Run pip3 install -r requirements.txt.
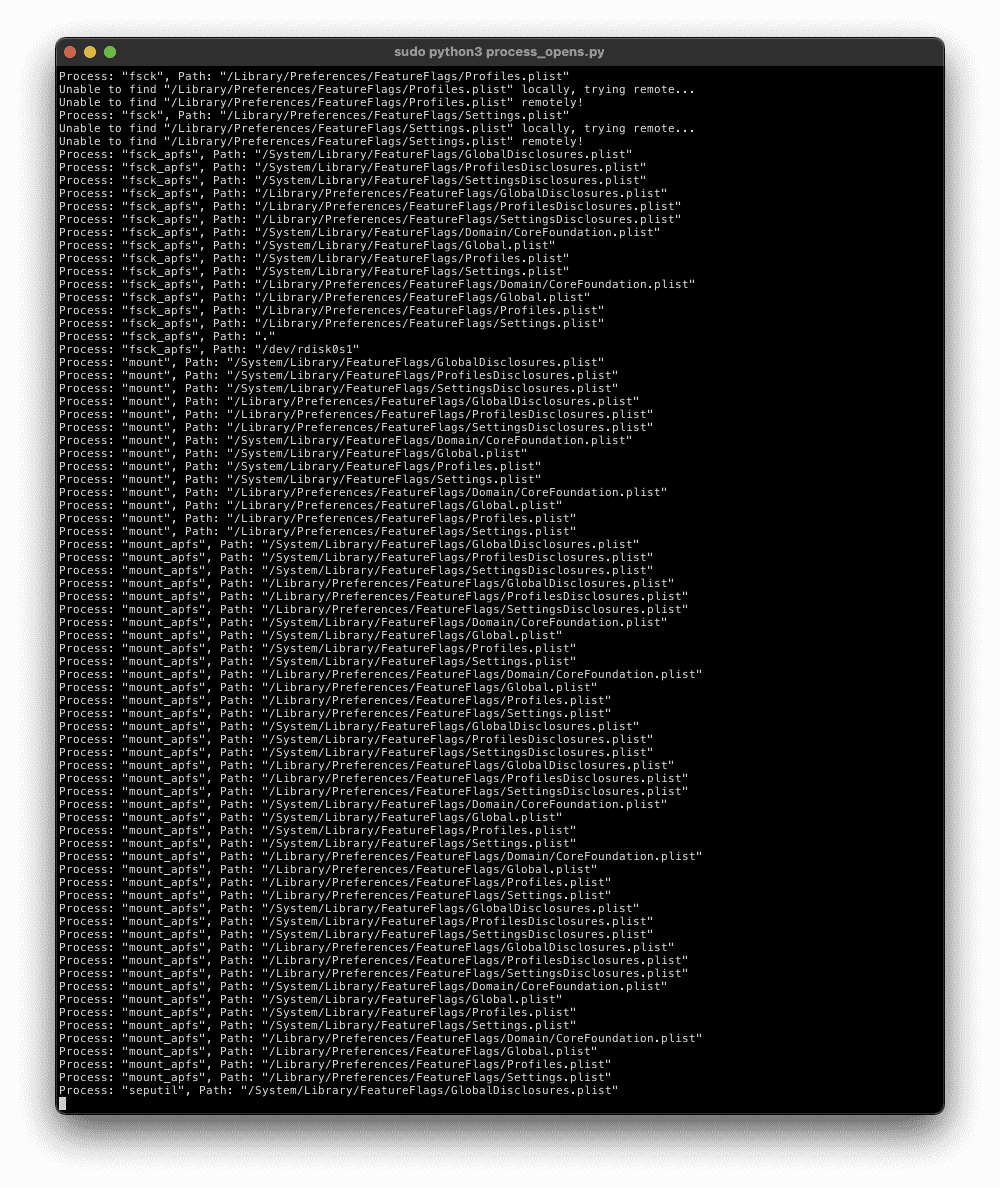
- Run sudo python3 file_opens.py (Needs to be root to read arbitrary files in the mounted root filesystem, since enableOwnership is active). This will take awhile!
Once the script finishes running, we can view the full data in the Neo4J query browser:
MATCH (n) RETURN n
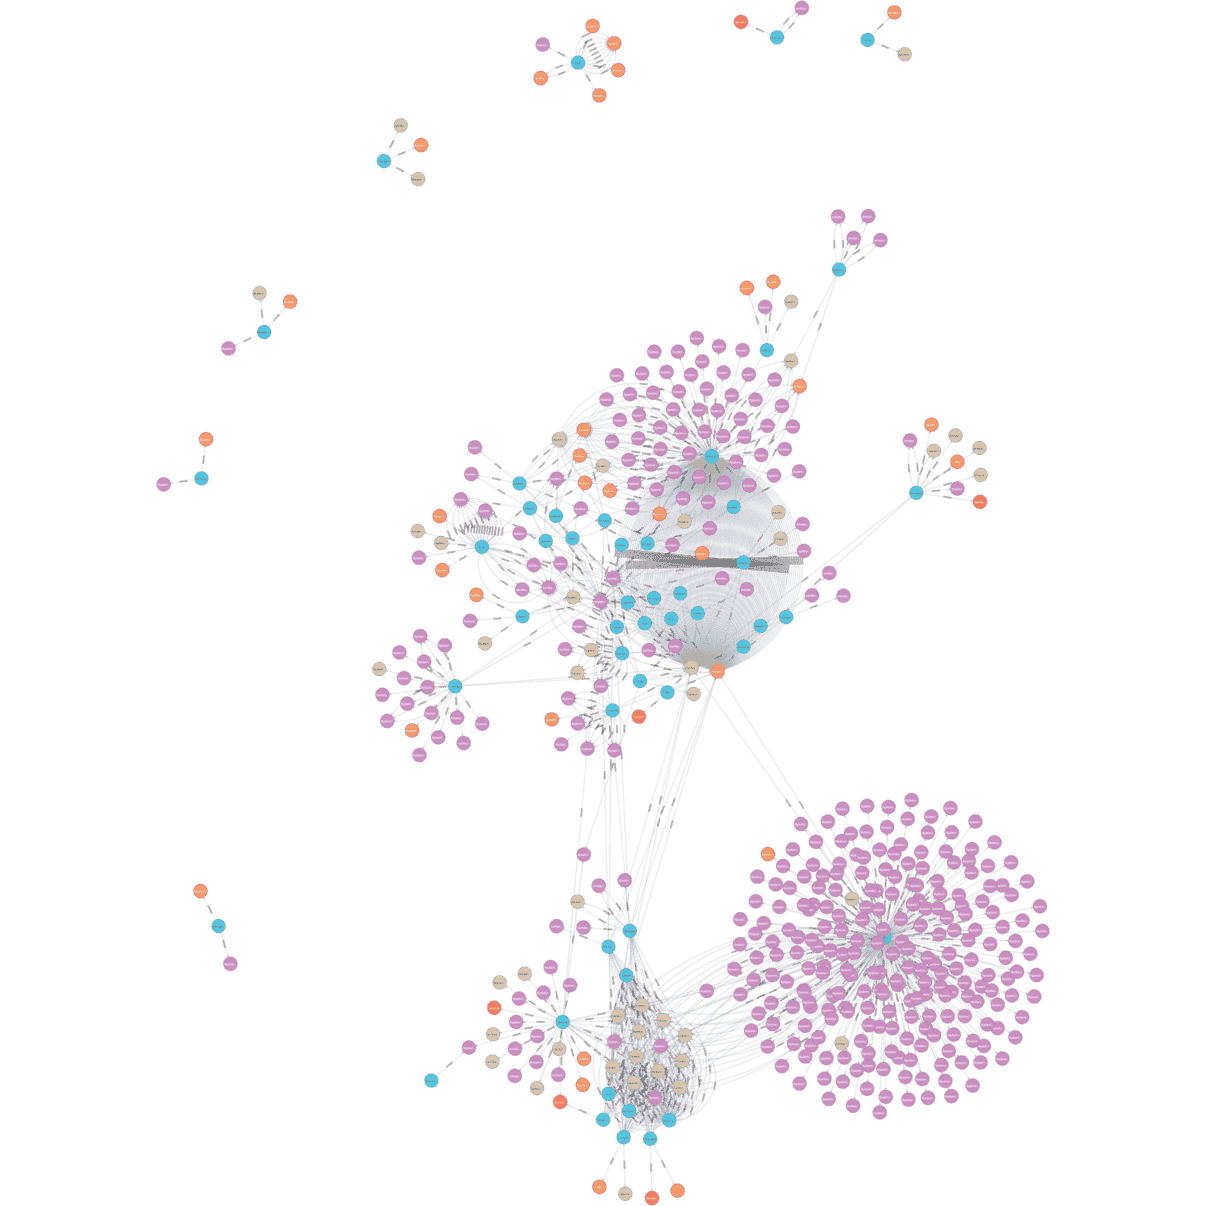
Note that by default Neo4J limits the number of nodes it returns. In this graph the limit has been increased to 500 by clicking the settings icon and changing Initial Node Display under Graph Visualization. While in the settings the max neighbors field should also be increased to 500 for later use. Even with 500 nodes displayed, that only covers 50 processes out of a total of 277, so this is still a fairly small segment of the total graph.
It might be easier to start by showing only the processes and drilling down into interesting ones from there.
MATCH (p:Process) RETURN p

This graph isn't particularly interesting, but selecting a process at random and querying for it should provide some useful insight:
MATCH (p:Process)-[r:OPENED]->(f:File)
WHERE p.name = 'backboardd'
RETURN p, f
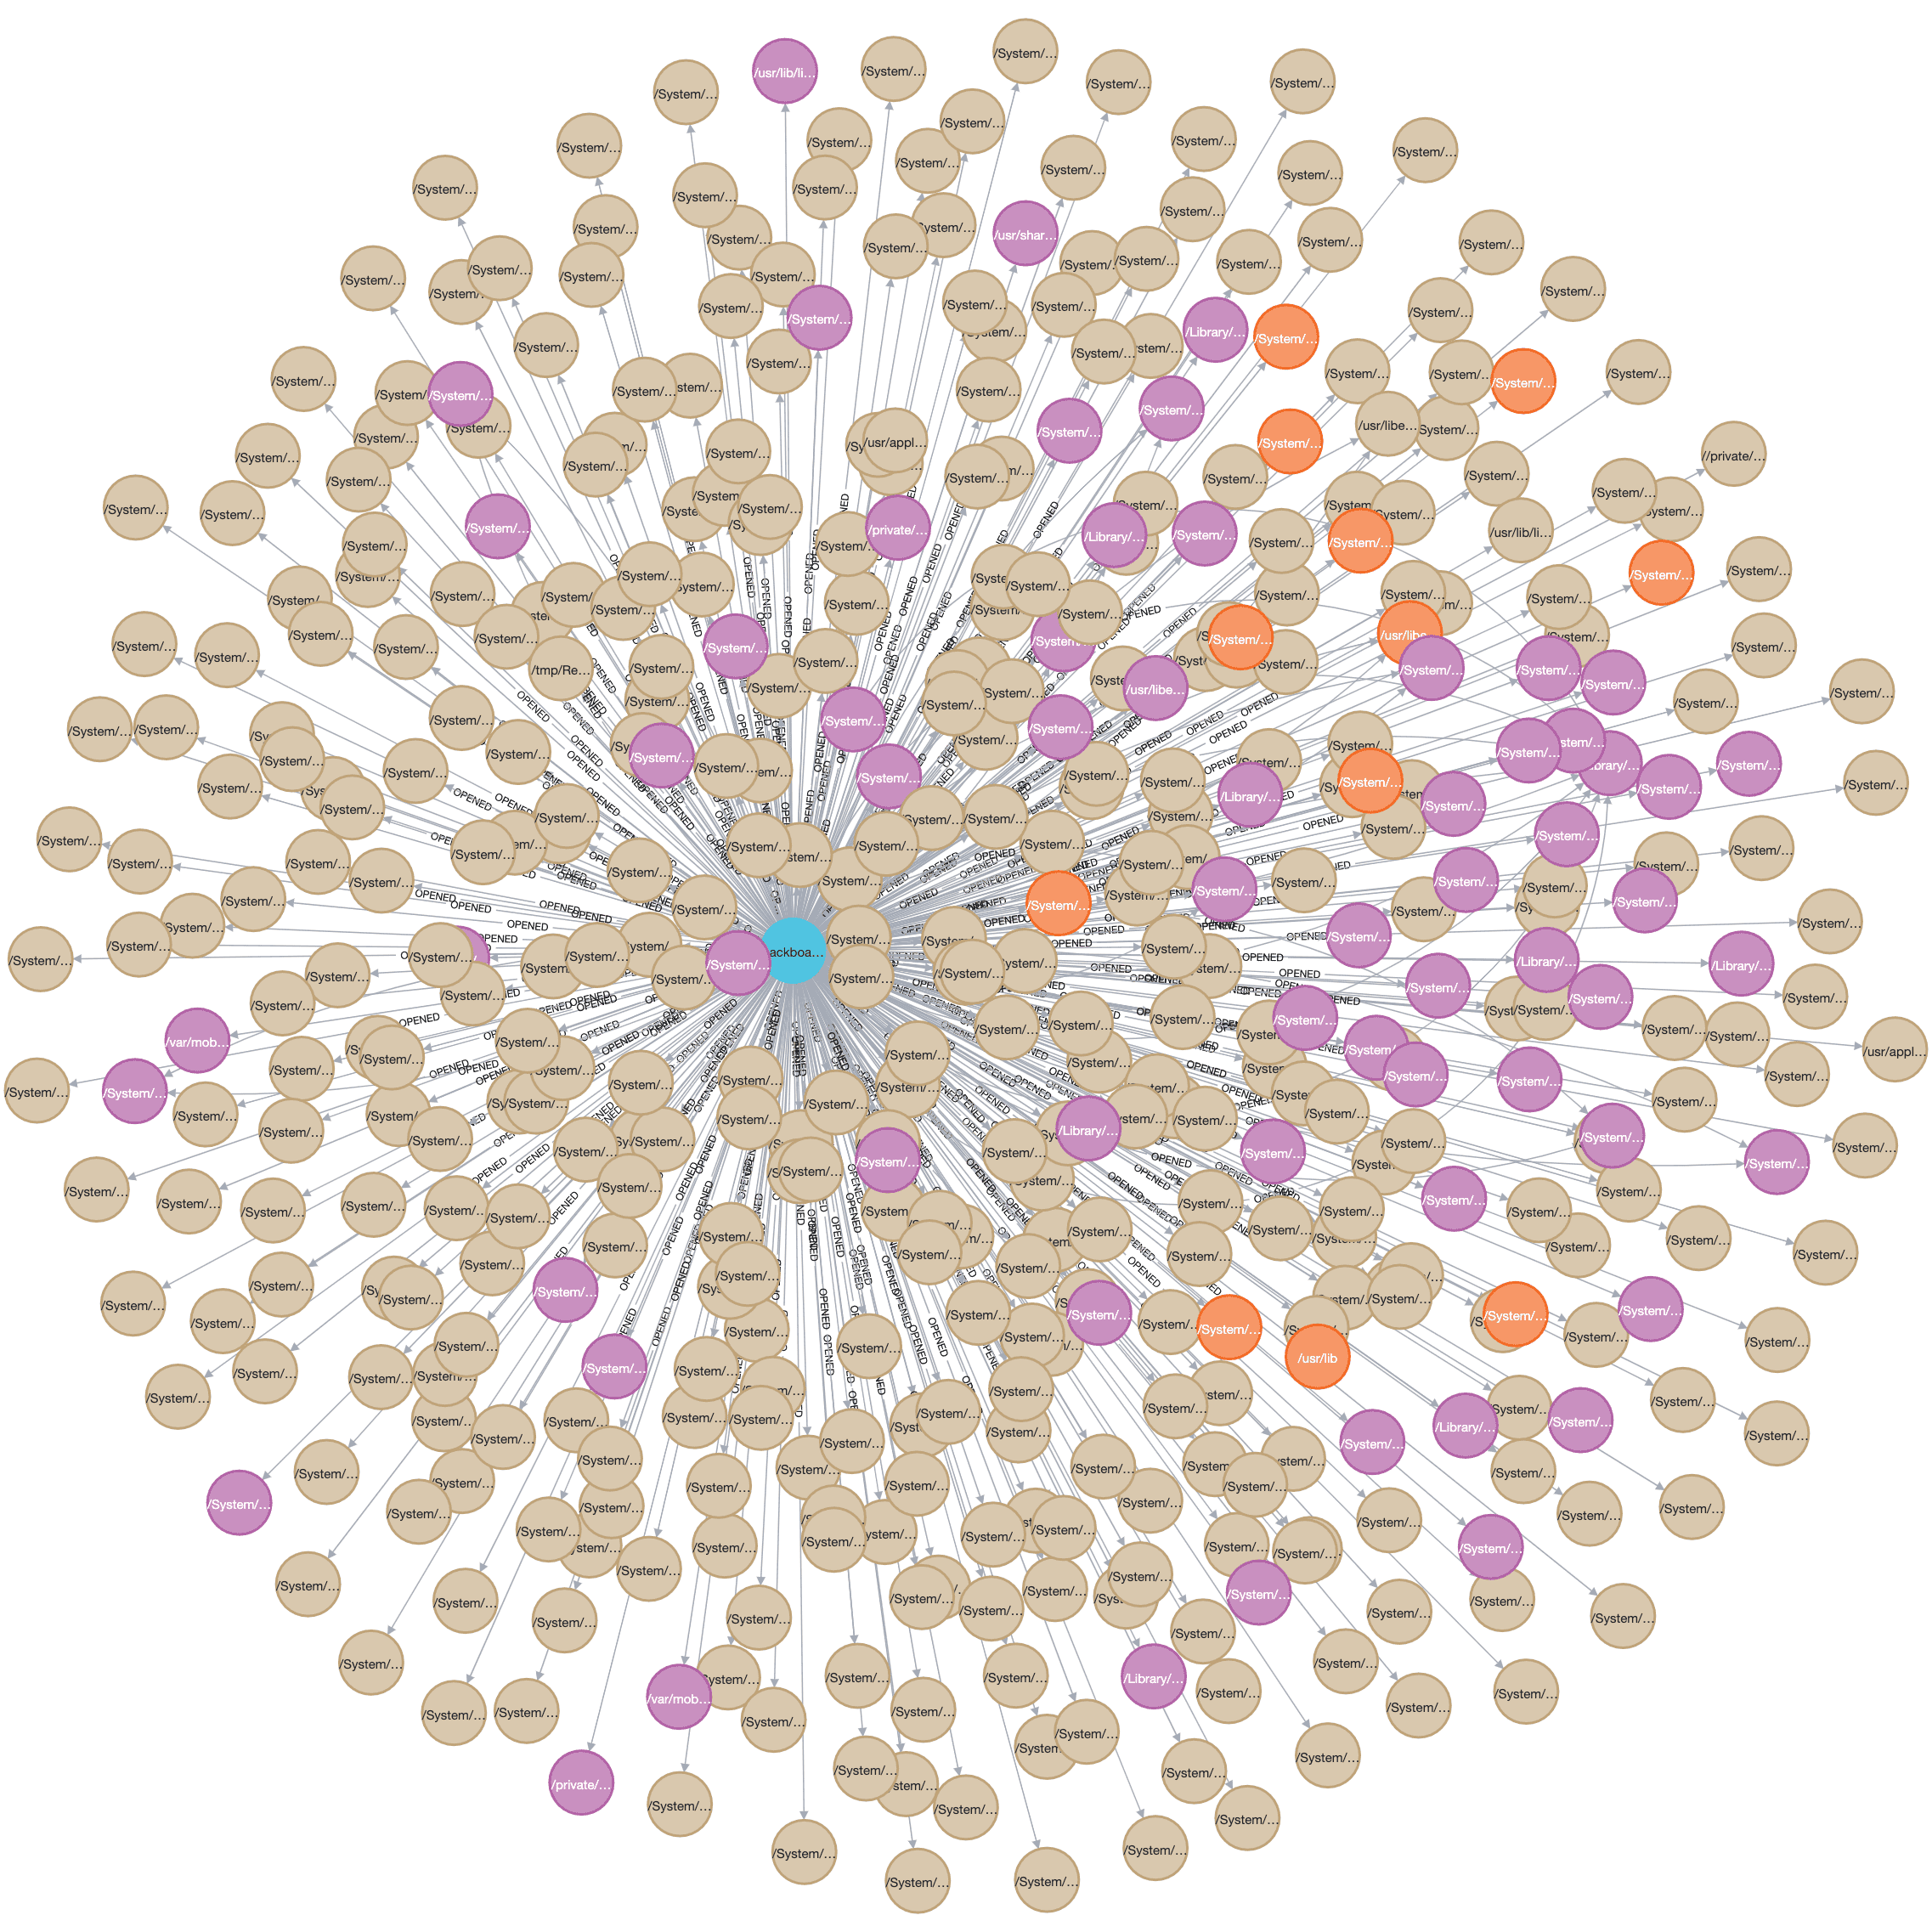
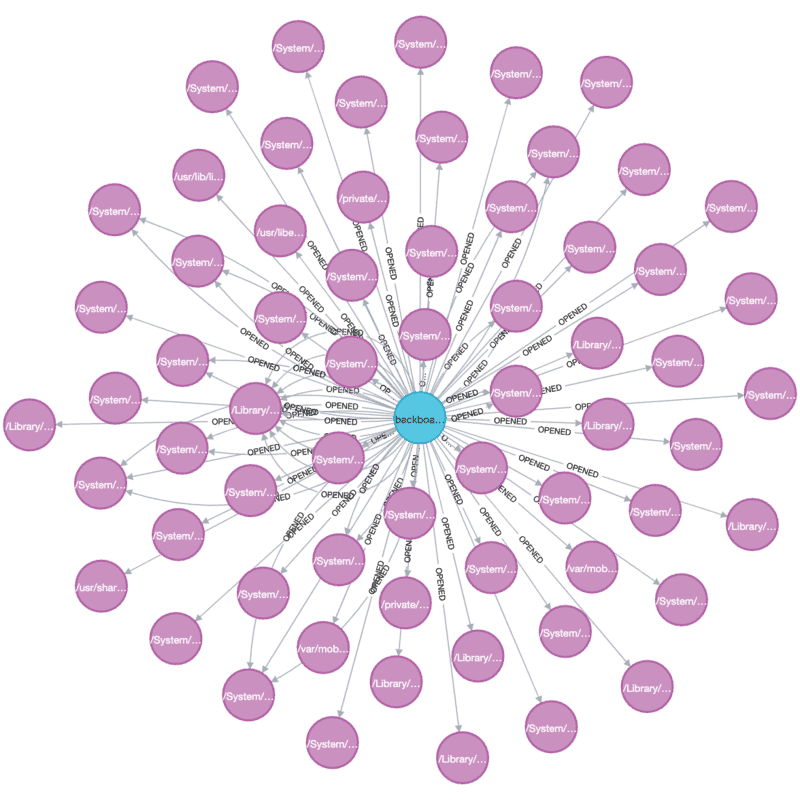
In this case there are many missing files opened, which are overwhelming the more immediately-useful files that do exist. This can be solved by tweaking the query a bit to remove :MISSING and :DIRECTORY nodes:
MATCH (p:Process)-[r:OPENED]->(f:File)
WHERE p.name = 'backboardd' AND NOT f:MISSING AND NOT f:DIRECTORY
RETURN p, f

We can also limit the path prefixes that are relevant, such as only showing files under /var/mobile and /private. Since many processes open MobileGestalt.plist, excluding that can improve the clustering a bit and make it easier to see when processes are related:
MATCH (p:Process)-[r:OPENED]->(f:File)
WHERE NOT f:DIRECTORY AND NOT f:MISSING AND (f.path STARTS WITH '/var/mobile' OR f.path STARTS WITH '/private/') AND NOT f.path CONTAINS 'MobileGestalt.plist'
RETURN p, f
The next step would be to start digging into the data to find interesting files, which is left as an exercise to the reader. This is meant as a map for further reverse engineering by identifying which processes merit investigation. Some possible things to look for:
- Many of the opened files are in the Apple Property List (plist) format, either in binary form or XML. This format can get complex due to its ability to serialize many types of data structures.
- Binary data which may require a purpose-built parser.
- Images, which could be used to reach the vulnerability-prone ImageIO attack surface.
- Missing files/directories which could enable otherwise-unreachable functionality.
Limitations and possible improvements
There are a number of limitations of this approach and implementation:
- If the opened file is present on the local filesystem (from the IPSW) then its metadata is always used, even though the file on the virtual device may be different. Since it might be useful to know if a file has been modified from the original, statting the remote file would be a good start along with comparing hashes if file sizes do not match.
- This is inherently a subset of the possible files that are opened during boot, subject to the configuration of the device. For example, the racoon VPN client will probably never be executed without a VPN profile present in the first place.
- This relies on manually stopping at some point after boot completes, which could lead to extra entries that aren't necessarily boot-related, or missing entries from being stopped prematurely. This makes it difficult to compare different runs, for example while trying to determine the new attack surface between iOS 15.5 and iOS 15.6.
There are also possible improvements:
- The process_opens.py script does not attempt to multithread at all. Splitting the input file into multiple slices should allow batching between multiple workers and substantially speed up the process.
- process_opens.py is lacking error checking in many cases, which can lead to lost data.
- Further enrichment data could be collected, such as the UID of each process. This will allow easier identification of which processes are more valuable for high-privilege persistence.
Conclusion
In this post we described a real-world vulnerability research use case for Corellium's virtualization platform, including advanced features such as the iOS kernel debugger and hypervisor hooks. We also covered a small portion of kernel internals in the form of system call handlers. We learned the basics of using a graph database, Neo4J, along with how to load the data and perform useful queries.
Importing the sample data
The source code repository for this post contains a pre-generated uniq_opens.txt file, which can be used to skip the data collection and follow the steps starting from Analyzing the Data.
1: Jailbreakers typically use the term "untether" instead of persistence, but it's the same concept.
2: Creating the devices as jailbroken would add noise to the results and wouldn't be representative of the real attack surface.
3: There are a number of other monitor commands, try `process plugin packet monitor help` to see a list!
Unlock Superior Mobile Security Testing with Corellium
Equip your security teams with unprecedented tools for both manual and automated testing, freeing up valuable engineering time and saving money. Discover the power of Corellium’s high-fidelity virtual devices and spin-up near limitless combinations of device and OS with one-click jailbreak/root access. Book a meeting today to see how we can streamline your processes and reduce costs.